Dosimetry#
Plates related to radiation protection. The concept essential is the dose which represents the energy absorbed (ie deposited by the electrons expelled during of photon-matter interactions) related to the mass of the region of the body considered. Its unit is J/kg which is gray by definition.
Irradiation & Dose#
There are three types of irradiation:
External exposure, the source of exposure is outside the body and remote;
Internal contamination, the radioactive material passed through the body by ingestion, inhalation or sore;
External contamination, the source in contact with the body, on the skin.
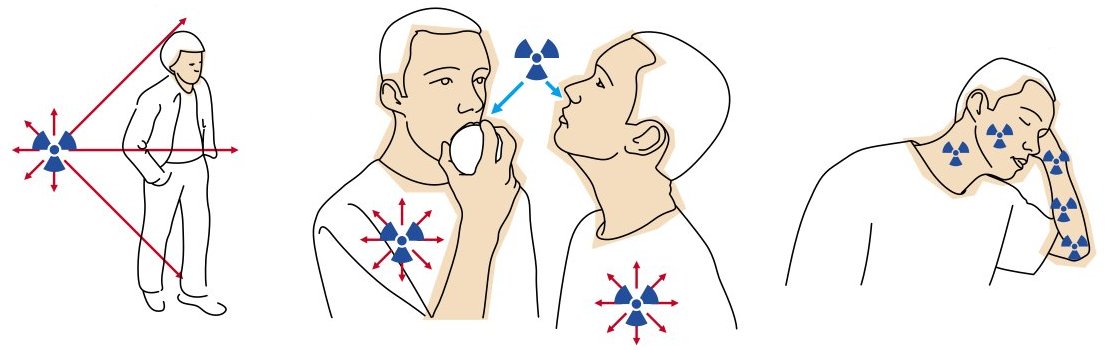
Fig. 176 Types of irradiation. External (left), internal contamination (middle), and external contamination (right) From IRSN#
Dose
Effective dose (biological tissue)
where
\(w_R\) is the weighting factor due to radiation of type R
\(w_T\) is the weighting factors of a specified organ or tissue T
\(D_{T,R}\) is the average absorbed dose in tissue T, due to radiation R
The ICRP Publication 103 published recommendations for a system of radiological protection:
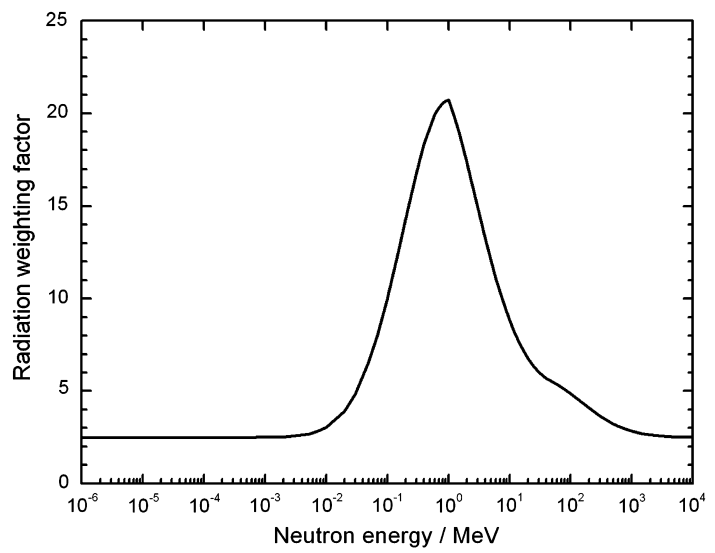
Fig. 177 Neutron weighting factor#
Recommended radiation weighting factors \(w_R\)
Radiation type |
\(w_R\) |
|---|---|
Photons |
1 |
Electrons, muons |
1 |
Protons, charged pions |
2 |
Alpha particles, fission fragments, heavy ions |
20 |
Neutrons (depends on the energy) |
1-20 (see Fig. 177) |
Recommended tissue weighting factors \(w_T\)
Tissue |
\(w_T\) |
\(\sum w_T\) |
|---|---|---|
Bone-marrow (red), Colon, Lung, Stomach, Breast, Remainder tissues |
0.12 |
0.72 |
Gonads |
0.08 |
0.08 |
Bladder, Oesophagus, Liver, Thyroid |
0.04 |
0.16 |
Bone surface, Brain, Salivary glands, Skin |
0.01 |
0.04 |
Total |
1.00 |
The annual dose limit is \(1\,\)mSv (public) and \(20\,\)mSv (at risk) which is equivalent to a risk of \(10^{-4}\) for cancer. There are two types of biological effect of the radiations on the human body
Deterministic effects: high exposure levels and early symptoms (hours or days). The higher the exposure, the more severe the symptom.
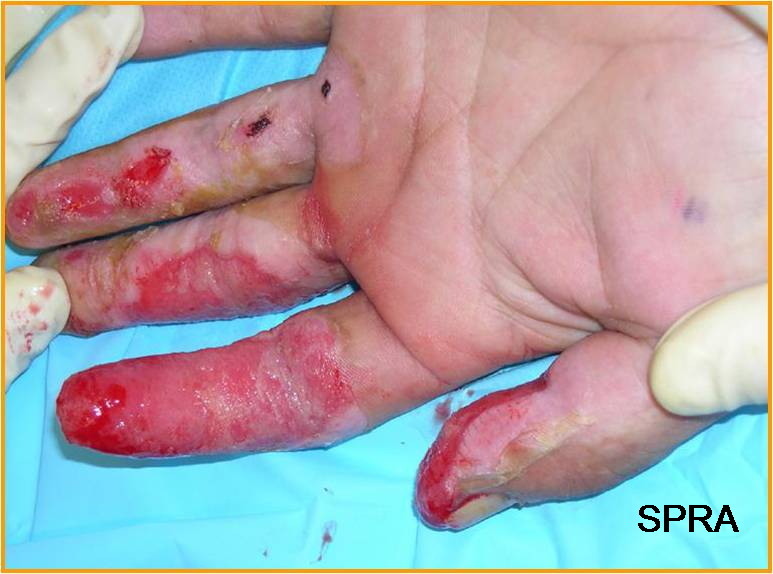
Fig. 178 Radiodermatitis#
Stochastic effects: low exposure levels and late symptoms (tens of years). The higher the exposure, the more probable the symptom.
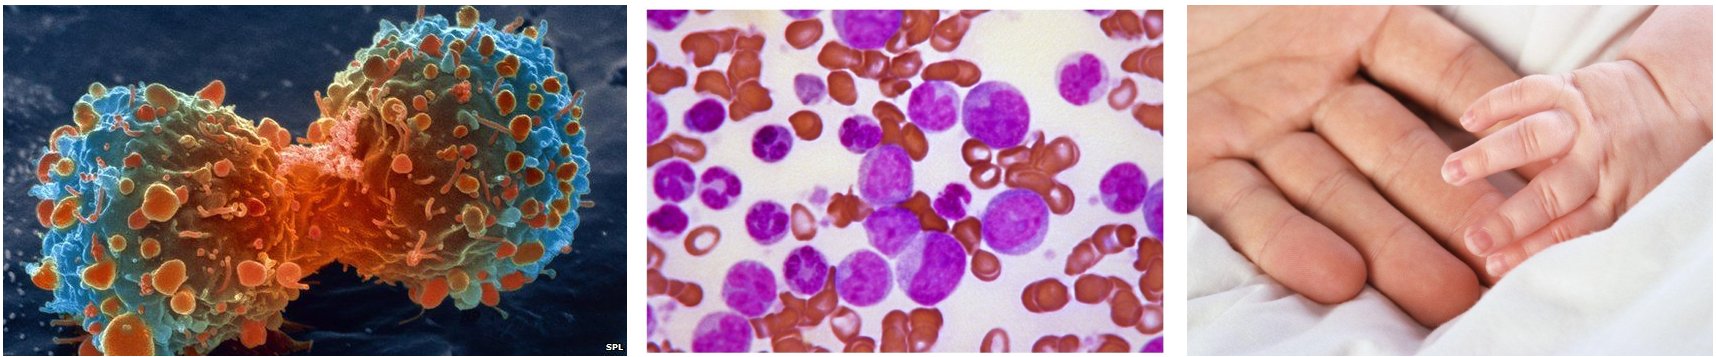
Fig. 179 Cancer (left), leukemia (middle), and to the offspring (right)#
Here is a summary chart of the exposure levels and the symptoms.
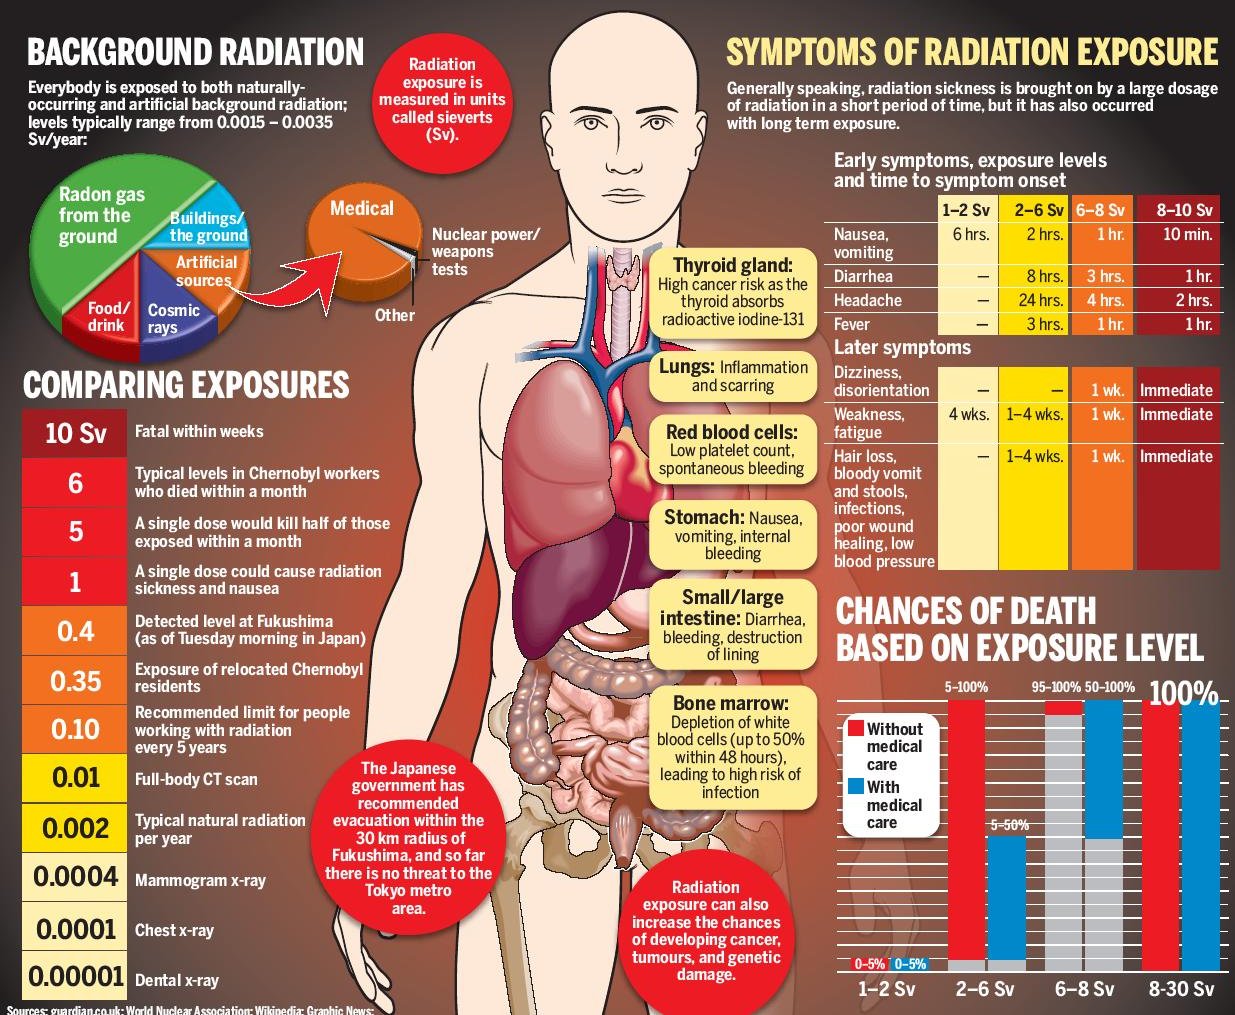
Fig. 180 Exposures and symptoms#
Radioprotection#
In France, the IRSN studies the radioprotection in terms of number of exposed workers and exposures.
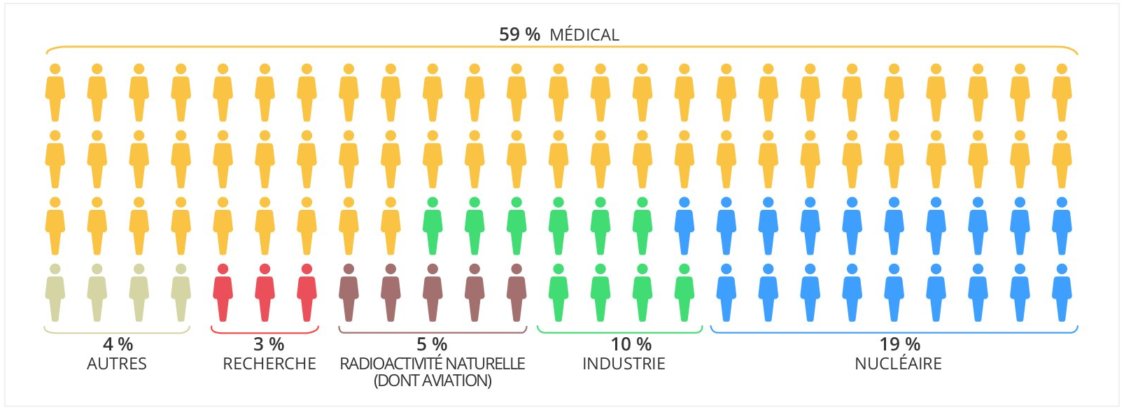
Fig. 181 Number of exposed workers broken down by activity domains#
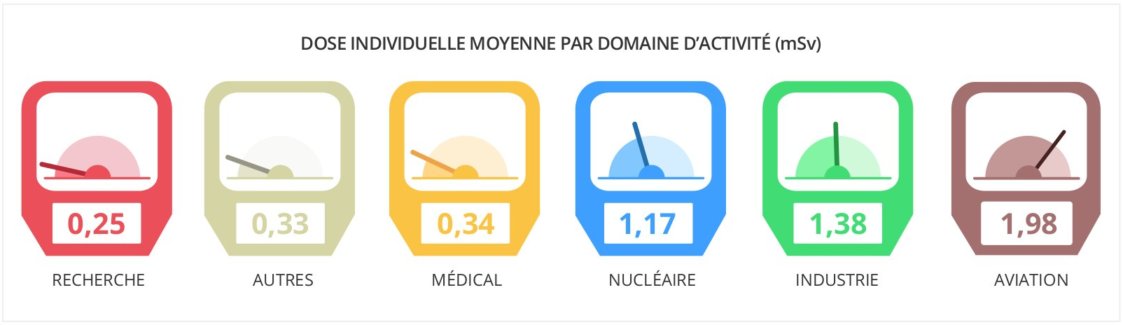
Fig. 182 Mean annual dose#
Signs are used to limit zones of different exposure risks.
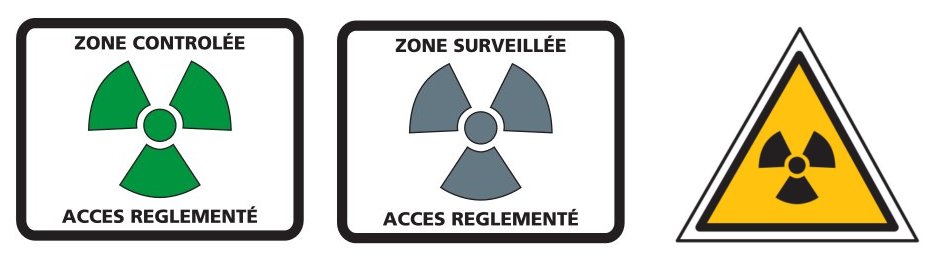
Fig. 183 Signs for zones and materials#
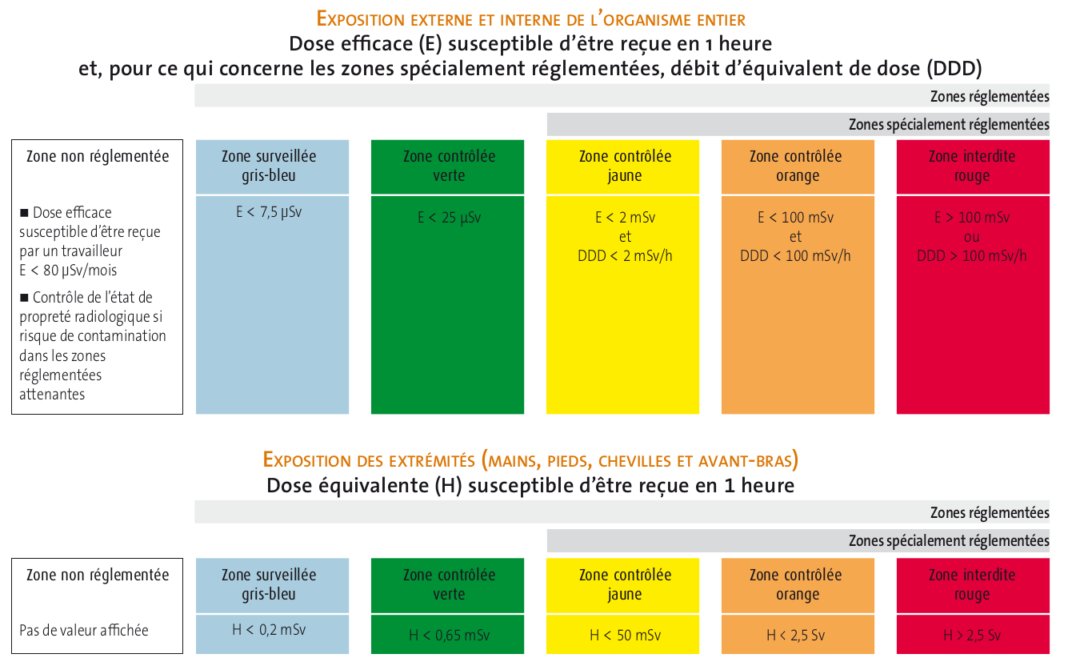
Fig. 184 External exposures risks and zones#
Portable dosimeters (passive or active) are used by exposed workers to assess their exposure. In France, the doses received by the exposed workers are centralized in the SISERI system. These data are returned under certain conditions to occupational physicians and to radiation protection inspectors in order to optimize the medical surveillance and radiation protection of workers.
passive dosimeters are used to integrate the dose, and the measurements are regularly archived (every month typically) archived in the worker’s file and followed for at least 20 years. Several techniques exist: Film dosimeters (originally), Thermoluminescent dosimeters (TLD), Radiophotoluminescent (RPL) glass dosimetry systems, and Optically stimulated luminescence (OSL) systems.
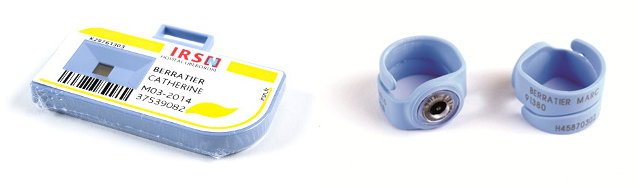
Fig. 185 Passive dosimeters: chest or full body (left), hand (right)#
active dosimeters are used to monitor the received dose. Real-time display of the dose or dose rate is possible with these electronic diode dosimeters. In a silicon diode, the radiation causes charge deposits which are transformed into electrical pulses, and converted into dose equivalent.
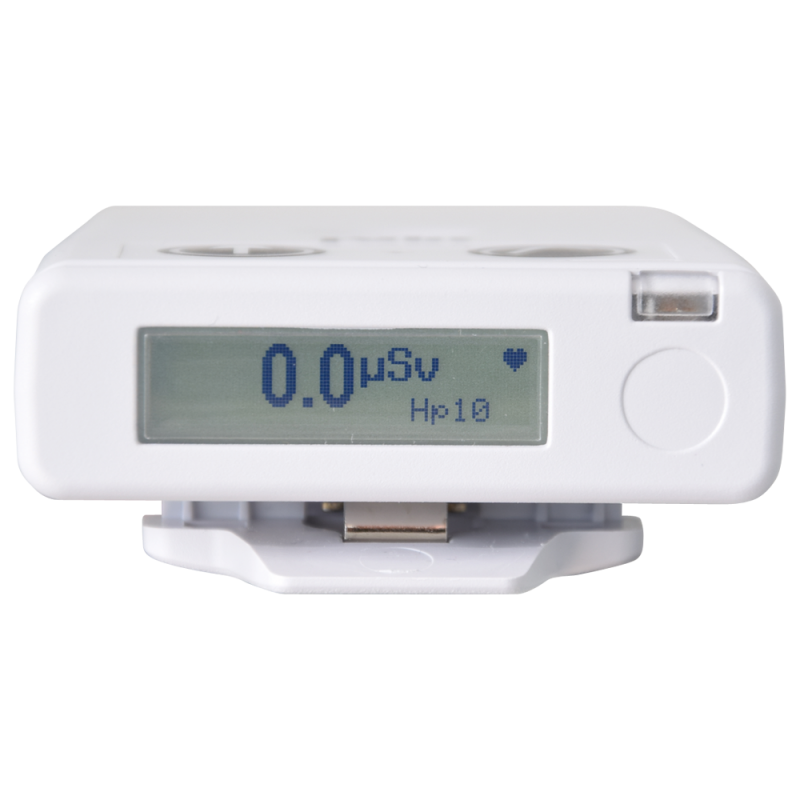
Fig. 186 Electronic personal dosimeter.#
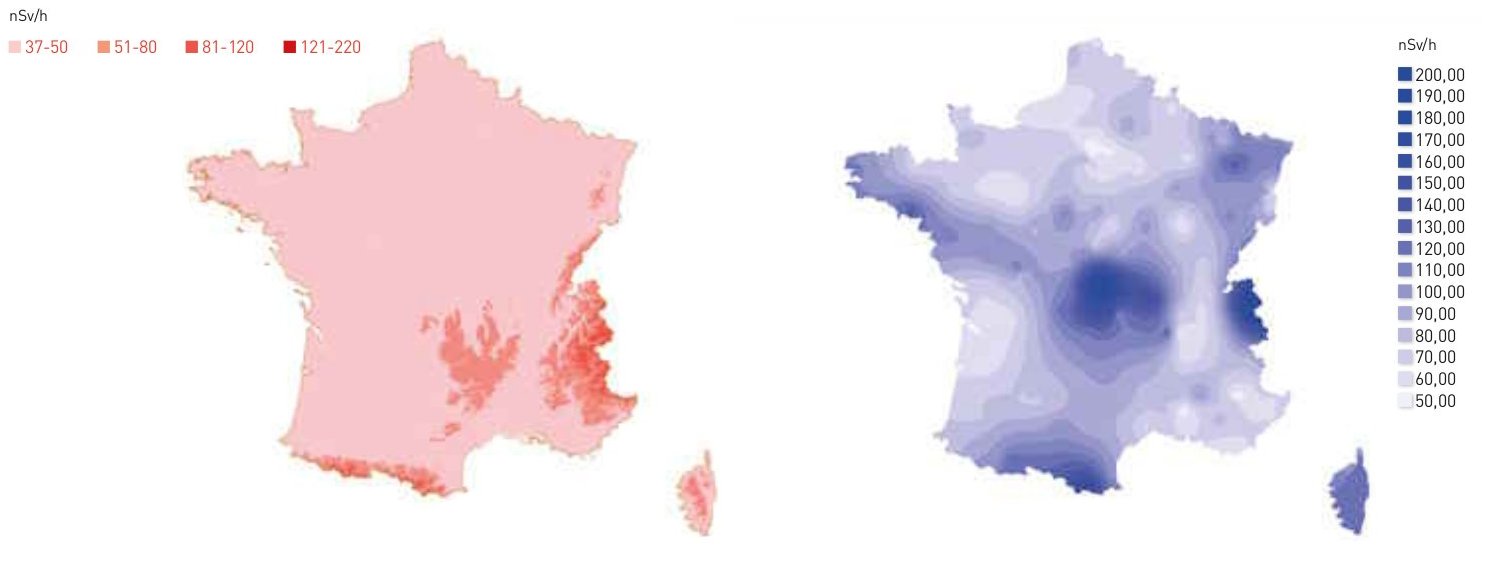
Fig. 187 Exposures to cosmic radiations (left) and ground (right)#
Cosmic radiation doses received on board an aircraft are higher than on the ground. Flight crews can receive an effective dose of several millisieverts per year as a result of their occupation. See IRSN online evaluation.
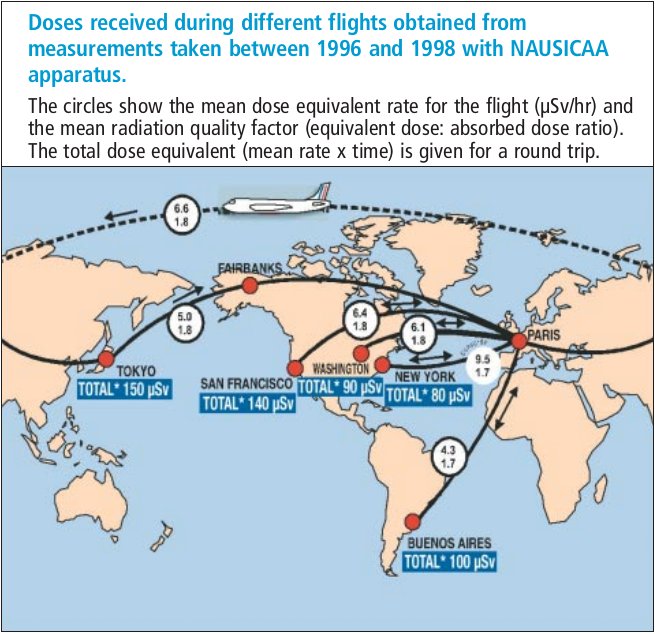
Fig. 188 Doses received during flights. Data from IRSN#
There is an order of magnitude between extrema internal exposures to radionuclides in France (see Fig. 189). Data from IRSN.
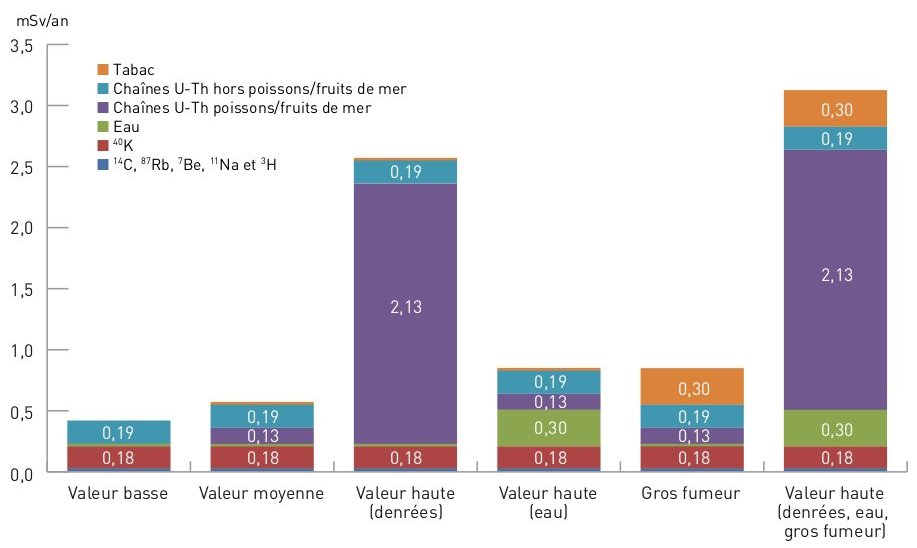
Fig. 189 Summary of doses (expressed in mSv/yr) due to the incorporation by an adult of natural radionuclides#
The higher cancer incidence is first related to tobacco and alcohol, radiations are secondary concerns as Fig. 190 shows.
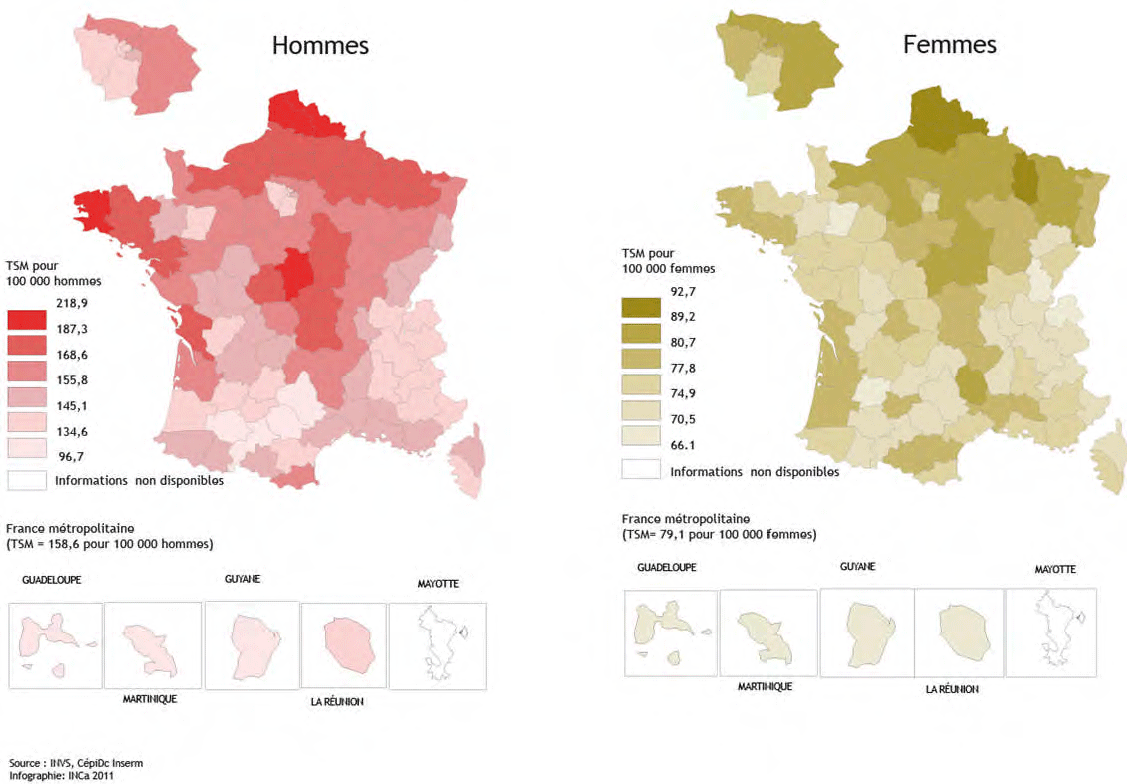
Fig. 190 Regional and sex differences in terms of cancer incidence#
Fig. 191 shows the Fukushima dose rate maps in air at \(1\,\)m above ground. Note that \(1\,\mu\)Sv/h is about \(9\)mSv/yr.
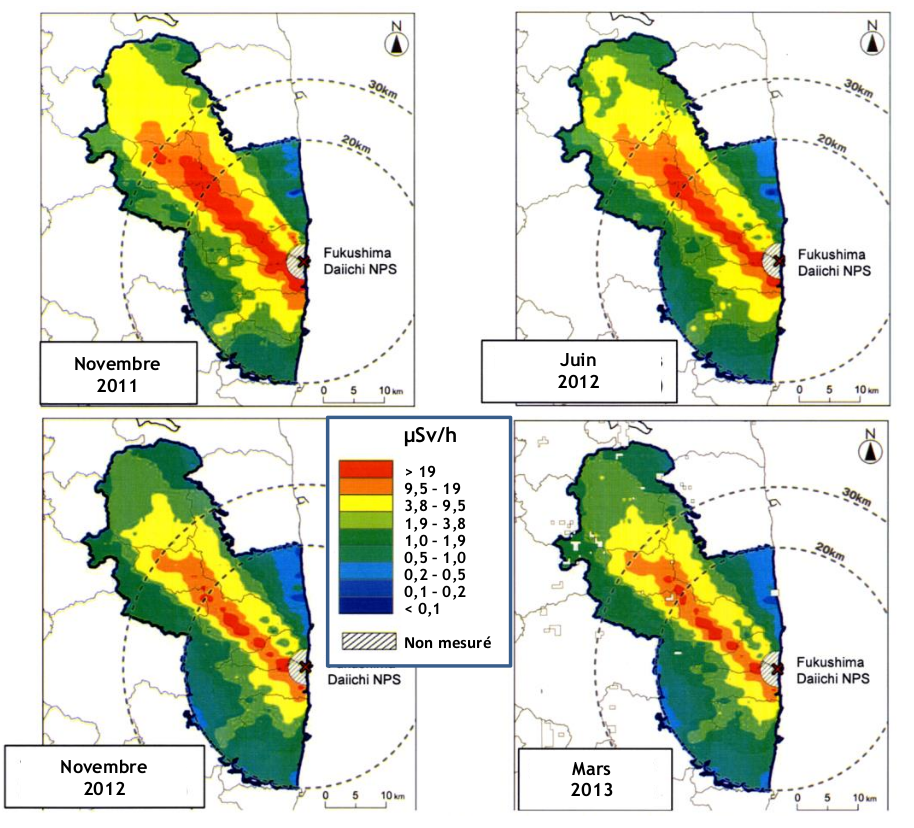
Fig. 191 Dose rate maps in time of the Fukushima area after the accident that occurred on March 11, 2011. Data from IRSN.#
Linear energy-absorption coefficient#
The link between the linear attenuation coefficient and the dose requires considering for each interaction which fraction of the incident energy of the photon is deposited by electrons. It is the notion of linear coefficient of energy absorption or \(\mu_{en}\).
Mass energy-transfer coefficient \({\mu_{tr}}/{\rho}\)
with energy-transfer fractions
with \(X\) is the average energy of fluorescence radiation and \(\langle E' \rangle\) the average energy of the Compton-scattered photon
Kerma: kinetic energy released in matter
Mass energy-absorption coefficient \(\mu_{en}\)
with \(g\) represents the average fraction of the kinetic energy of secondary charged particles that is subsequently lost in radiative energy-loss processes
Dose: relationship with the linear energy absorption coefficient \(\mu_{en}\)
In fact the linear energy-ebsorption attenuation coefficient \(\mu_{en}\) is smaller but not so different from the linear attenuation coefficient \(\mu\) (see Fig. 192).
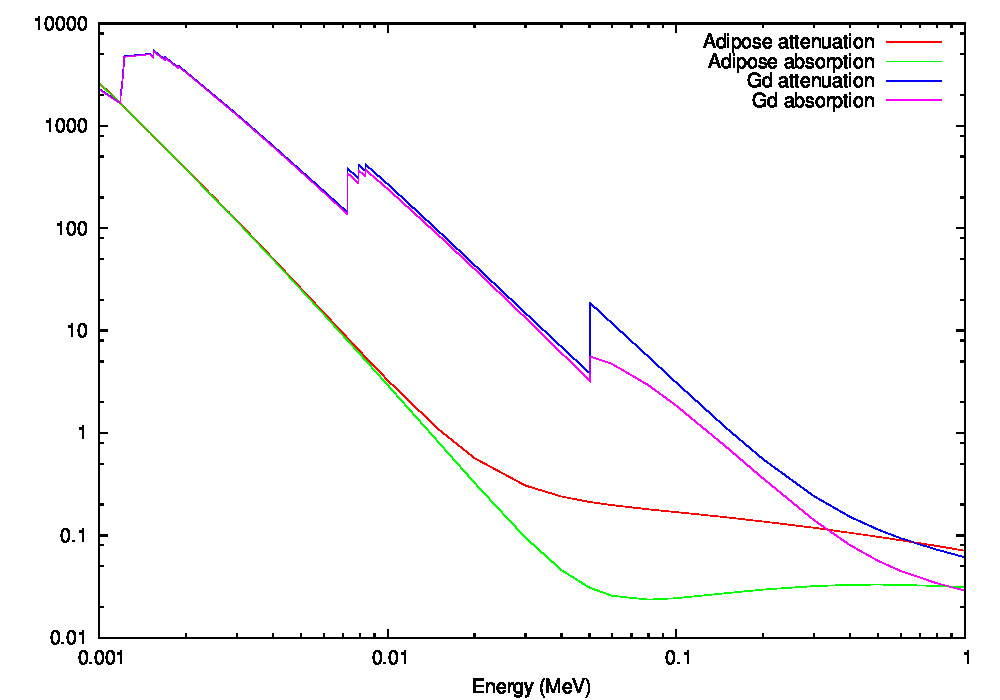
Fig. 192 Mass attenuation vs mass energy-absorption coefficients. Data from NIST XCOM#